首先视频快速预览下今天的学习内容:
今天继续学习streamlit,首先激活之前建立的虚拟环境:
1
2
3
4
❯ conda activate streamlit-env (streamlit-env ) ~ via 🐍 v3.9.16 via 🅒 streamlit-env ❯
进入到虚拟环境目录下,新建exercises文件夹,新建day1.py文件:
1
2
3
4
5
6
7
8
9
10
❯ fd streamlit-env anaconda3\envs\streamlit-env ❯ fd streamlit-env | cd ❯ mkdir exercises ❯ cd exercises ❯ code day1.py
在day1.py文件中写下第一行代码:
1
2
3
import streamlit as stst.write('Hello world!' )
保存,然后在终端中运行:
1
2
3
4
5
6
❯ streamlit run .\day1.py You can now view your Streamlit app in your browser. Local URL: http://localhost:8501 Network URL: http://192.168 .20.81 :8501
自动打开系统默认浏览器窗口并显示 “Hello world!”
恭喜,第一个程序运行起来了!
我们现在给页面加个按钮,实现点按钮后变换显示内容:
1 2 3 4 5 6 7 8 9 10 11 import streamlit as stst.write('Hello world!' ) st.header('st.button' ) if st.button('Say hello' ): st.write('Why hello there' ) else : st.write('Goodbye' )
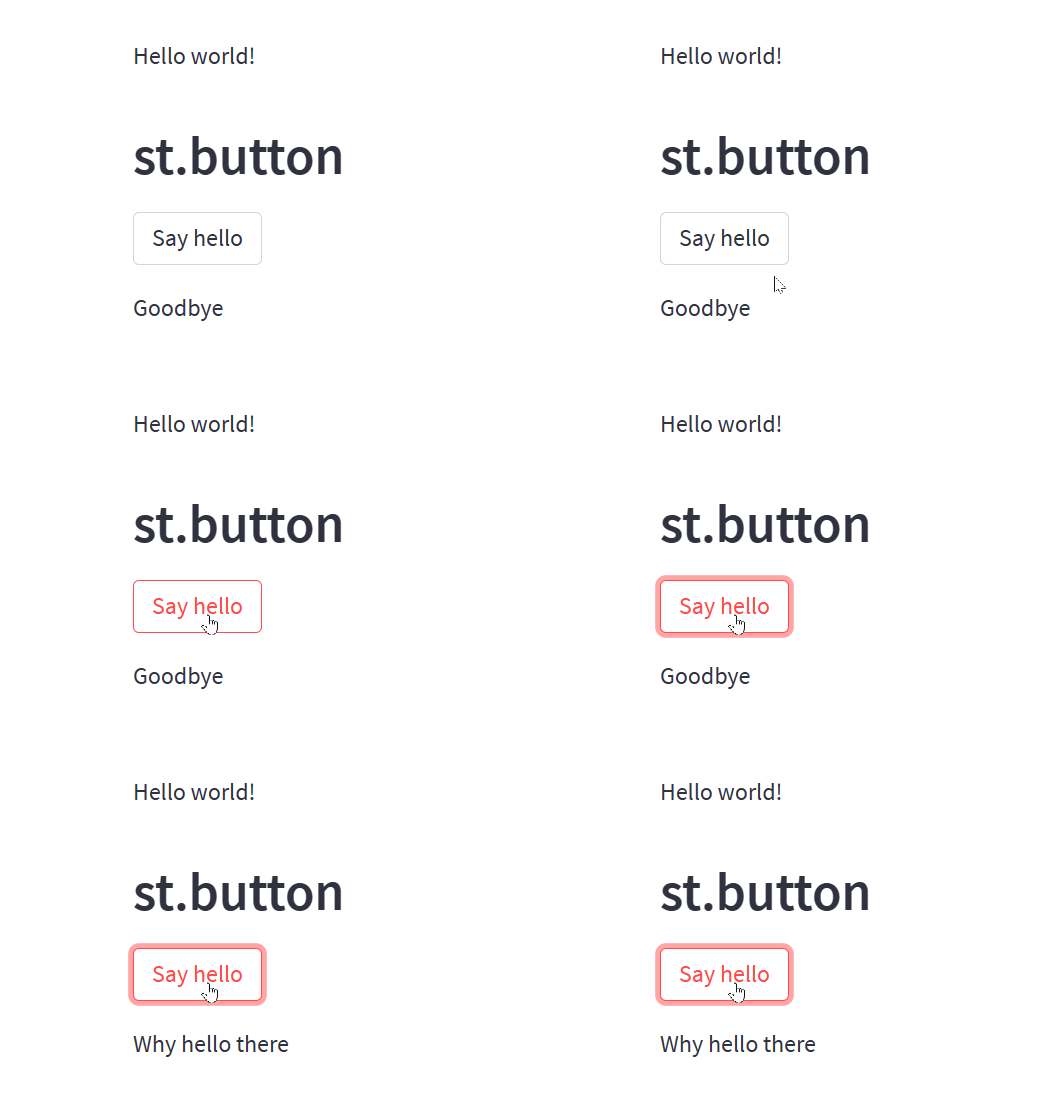
刷新下网页,会出现按钮:
上面演示了st.button最简单的用法,点击了解更多 。
1 st.button(label, key=None , help =None , on_click=None , args=None , kwargs=None , *, type ="secondary" , disabled=False , use_container_width=False )
Parameters
label(str)
按钮标签,通常用字符串,支持markdown语法的加粗、斜体、删除线,还支持emojis。
key(str or int)
可选的字符串或整型作为按钮部件的唯一键值,如果留空,则自动根据按键内容生成。
help(str)
可选的当鼠标悬浮在按键上时显示的提示信息。
on_click(callable)
可选的点击按钮的回调。
args(tuple)
可选的传给回调函数的元组参数。
kwargs(dict)
可选的传给回调函数的字典参数。
type(“secondary” or “primary”)
可选的指定按钮类型的参数,默认为”secondary”,为普通类型;”primary”则会着重强调。
disable(bool)
可选的布尔类型参数,默认为False,设为True则会禁用按钮。
use_container_width(bool)
可选的布尔类型参数,控制按钮是否匹配父容器宽度。
Returns
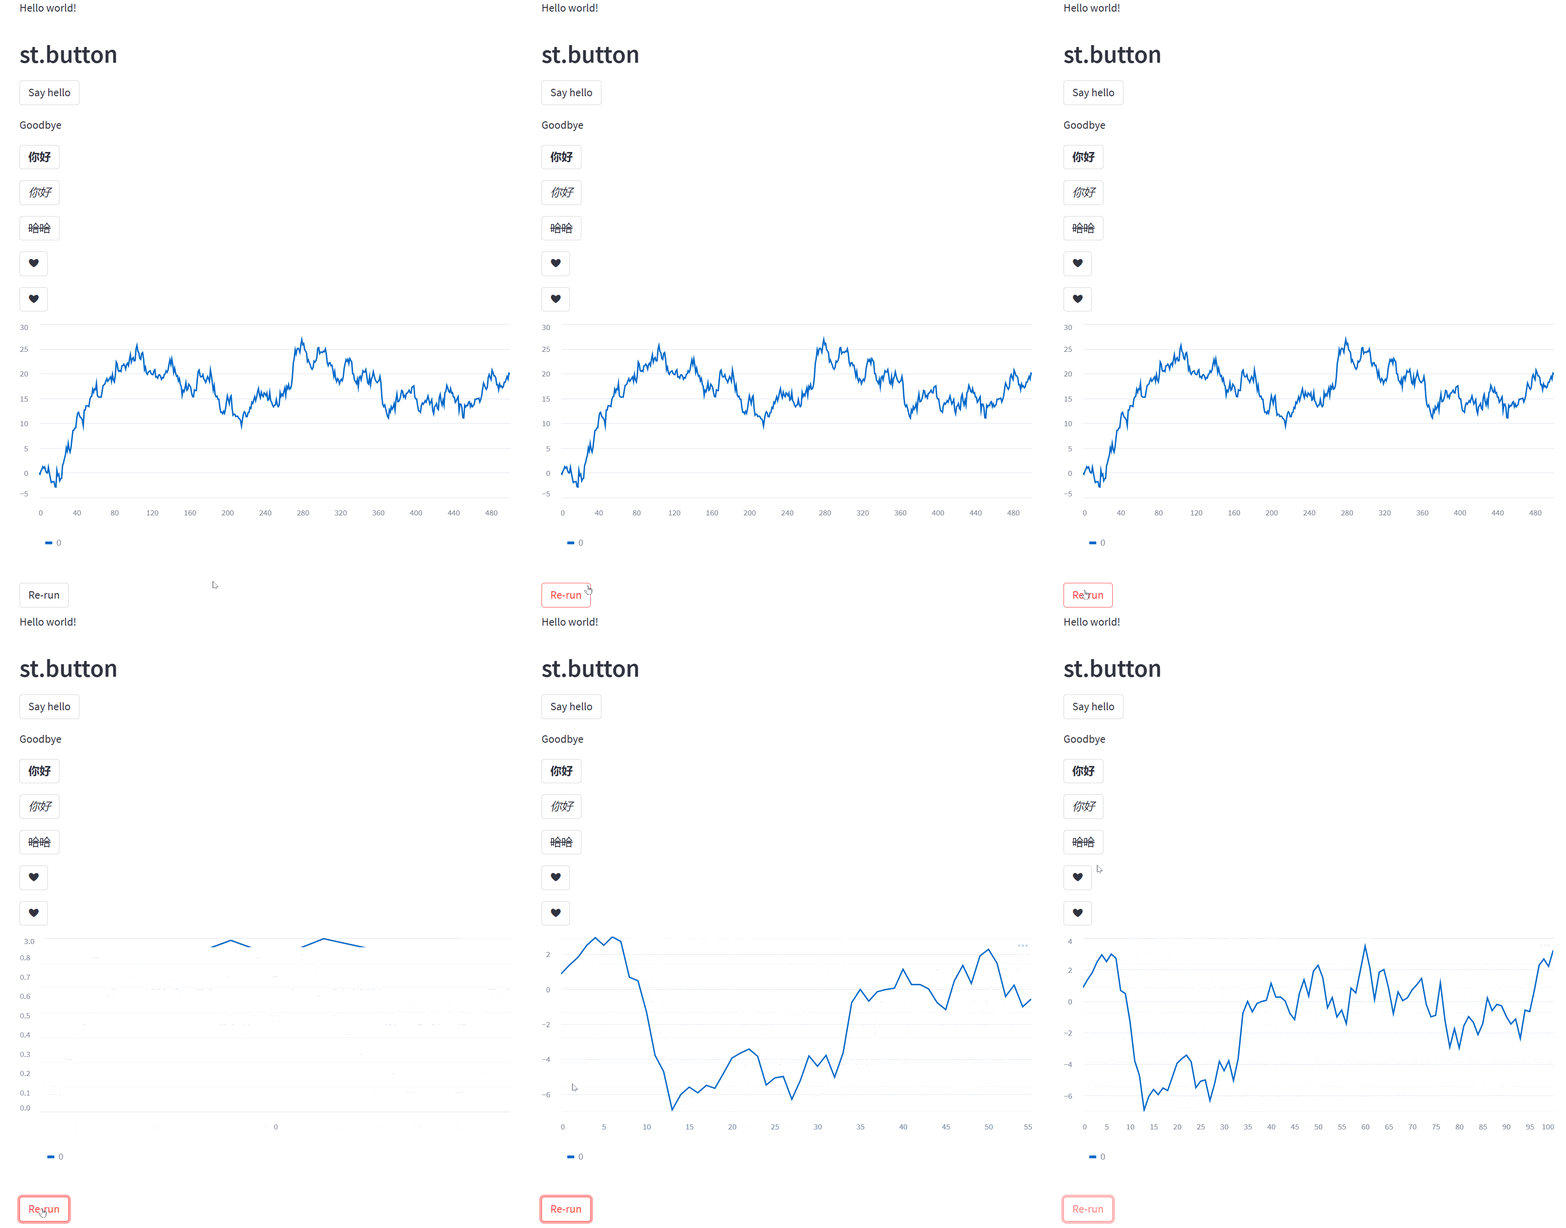
Demo
代码如下:
1
2
3
4
5
6
7
8
9
10
11
12
13
14
15
16
17
18
19
20
21
22
23
24
25
26
27
28
29
30
31
32
33
34
35
36
37
38
39
40
41
42
43
44
45
46
import streamlit as stimport numpy as npimport timest.write('Hello world!' ) st.header('st.button' ) if st.button('Say hello' ): st.write('Why hello there' ) else : st.write('Goodbye' ) st.button('**你好**' ) st.button('*你好*' ) st.button('~哈哈~' ) st.button('❤' ) st.button('❤' , key='1' , help ='This is a heart emoji button' ) def plotting_demo (): progress_bar = st.sidebar.progress(0 ) status_text = st.sidebar.empty() last_rows = np.random.randn(1 , 1 ) chart = st.line_chart(last_rows) for i in range (1 , 101 ): new_rows = last_rows[-1 , :] + np.random.randn(5 , 1 ).cumsum(axis=0 ) status_text.text("%i%% Complete" % i) chart.add_rows(new_rows) progress_bar.progress(i) last_rows = new_rows time.sleep(0.05 ) progress_bar.empty() st.button("Re-run" ) plotting_demo()

