学习streamlit-3
前两篇文章中一直在使用streamlit的方法st.write()来输出文本和参数到页面。
除了文本和参数,st.write()还支持以下内容的显示:
- 打印字符串,与
st.markdown()方法相似。 - 显示python字典。
- 显示
pandas数据帧,以表格的样式。 - 画图,来源可以是
matplotlib,plotly,altair,graphviz,bokeh。 - 更多特性还在添加。
st.write
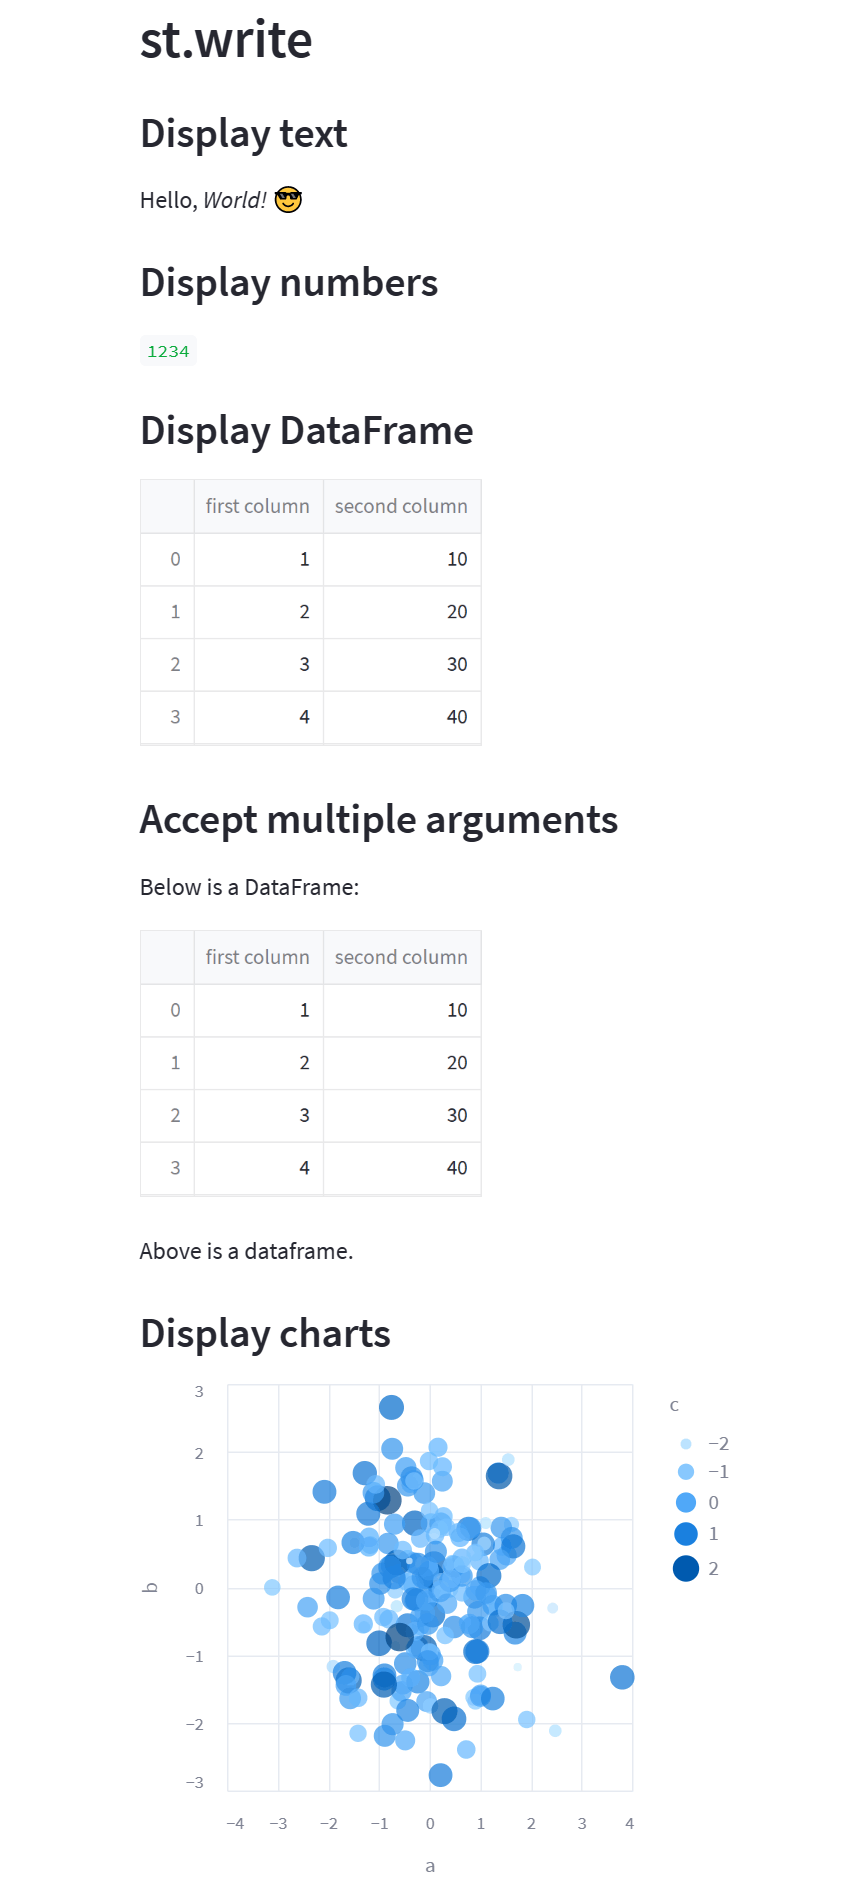
下面用一段代码来演示st.write()显示各种内容:
1 | import numpy as np |
运行后显示效果:
除了st.write()方法,还可以使用下面几个方法来显示内容:
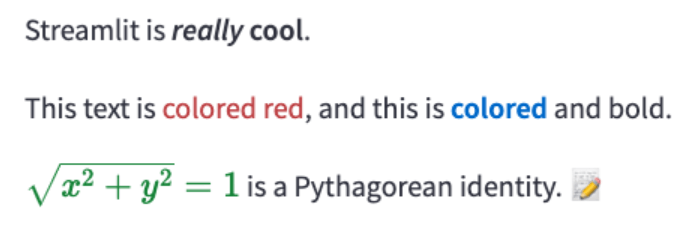
st.markdown
1 | import streamlit as st |
显示效果:
st.title
1 | import streamlit as st |
显示效果:

st.header
1 | import streamlit as st |
显示效果:

st.subheader
1 | import streamlit as st |
显示效果:

st.caption
1 | import streamlit as st |
显示效果:

st.code
1 | import streamlit as st |
显示效果:

st.text
1 | import streamlit as st |
显示效果:

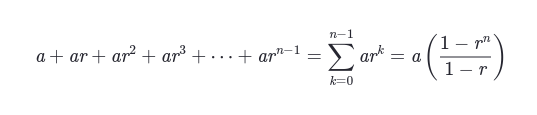
st.latex
1 | import streamlit as st |
显示效果:
magic
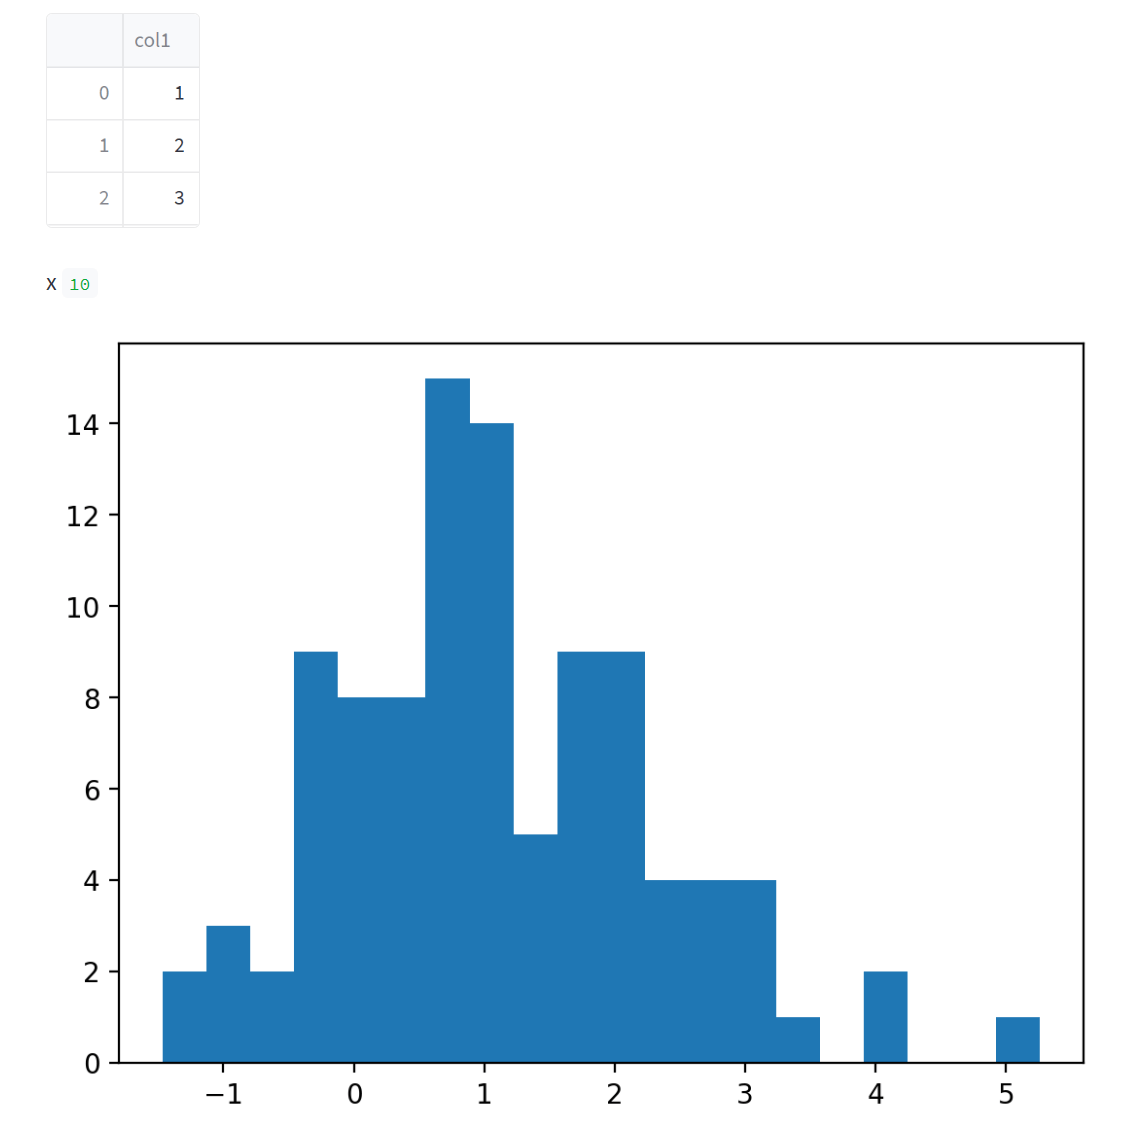
streamlit中还有一个”magic”命令,它可以让我们几乎显示任何东西,markdown、数据、图表等等,并且无需输入任何显式命令,只输入要显示的代码行本身就可以显示,比如以下代码:
1 | # Draw a title and some text to the app: |
运行后效果:
视频教程: